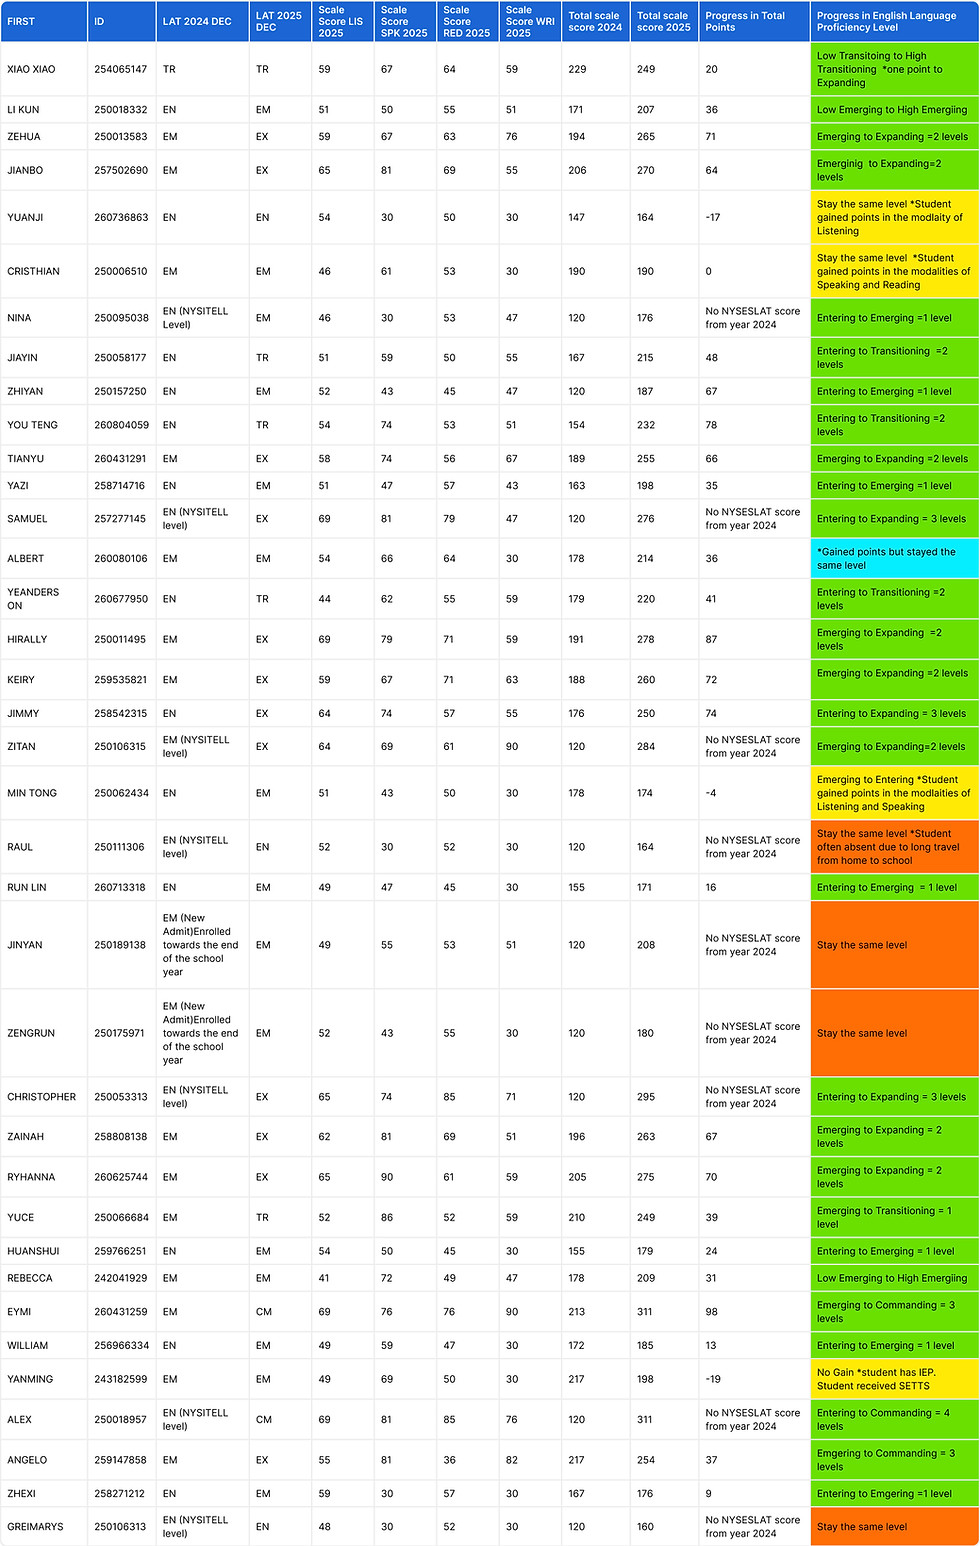
J.H.S 185 NYSESLAT Student Data Spring 2025
This chart captures student data from Spring 2025. The data shows the scaled score of all four modalities. It also shows the language proficiency level and as well the total scaled score for each student.
NYSESLAT Score Chart (NYS of Education)- Scale Score Ranges for Determining English Language Proficiency.
Grade
7th
120-169
170-212
213-249
250-299
300-360
Entering
Emerging
Transitioning
Expanding
Commanding
Students who stay the same level or did not test up a level
Reflection: analyze data to determine which modality or modalities students did not test well on. Next Step: address what needs or support are necessary to propel these students for growth.
Students who made gain in points and moved up level = 28
Growth Percent = 78.3%
Students who made gain but stayed the same level = 1
Students who made no gain = 4
Percent No Gain = 10.8%
Students who stay the same = 4
Percent Stay the Same = 10.8%
J.H.S 185 NYSESLAT Student Data Spring 2024
This chart captures student data from Spring 2024. The data shows the scaled score of all four modalities. It also shows the language proficiency level and as well the total scaled score for each student.

J.H.S 185 I-Ready School Year Fall BOY 2025 to Spring MOY 2026
(Data collected from 7th Standalone Classes (EN/EM ELLs), 7th Push-In ICT Class (TR/EXP ELLs), and 7th Push-In Self-Contained Class (TR/EXP ELLs).
The following i-Ready data charts capture Standalone ELLs (EN and EM) students, ELLs (TR and EXP) from Push-In ICT and Self-Contained classes.
Students who did not make gain in points from i-Ready BOY to MOY
Reflection: analyze data to determine which domain or domains students did not test well on. Next Step: address what needs or support are necessary to propel these students for growth.
i-Ready ENL Standalone ELLs

Number of Students Made Growth = 10
Made Growth = 52.6%
Number of Students Made No Growth = 8
No Growth = 42%
Number of Students Stay the Same = 1
Stay the Same = .05%
i-Ready 712/713 ICT

Number of Students Made Growth = 7
Made Growth = 63.6%
Number of Students Made No Growth = 3
No Growth = 27.2%
Number of Students Stay the Same = 1
Stay the Same = .09%
i-Ready 718 SC

Number of Students Made Growth = 8
Made Growth = 66.6%
Number of Students Made No Growth = 3
No Growth = 25%
Number of Students Stay the Same = 1
Stay the Same = .08%
Curriculum “Lift” Growth from Fall Unit 4 to Spring Unit 5 Assessment
(ENL Standalone total of 22 EN/EM ELLs)
Students made substantial growth in all three standards measured in the unit 5 assessment specifically in the short response. The student artifact contains 18 out of 22 samples that best represented growth in writing. The following writing samples captured a 81.8% growth.
Student Artifact - Low EN/EM ELLs
Growth from Entering level writing to Emerging/Transitioning level
These samples show growth from producing no writing or writing in Chinese or Spanish, to copying text from the assessment, and finally to students writing coherent short English sentences.


Growth from Emerging/Transitioning level writing to high Transitioning/Expanding level
These samples show students using simple and some compound English sentences. Some students use some tier 2/tier 3 vocabulary in their writing. Students also include punctuation and capitalization in their sentences.


Student Artifact - High EN/EM ELLs
Growth from Expanding level writing to high Expanding/Commanding level
These samples show students using simple, compound, and complex English sentences. Students use a variety of tier 2 and some tier 3 vocabulary from each unit. Students also incorporate strong use of punctuation and capitalization.


